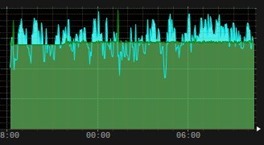
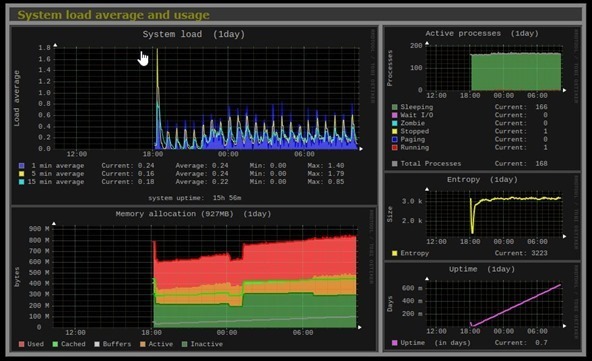
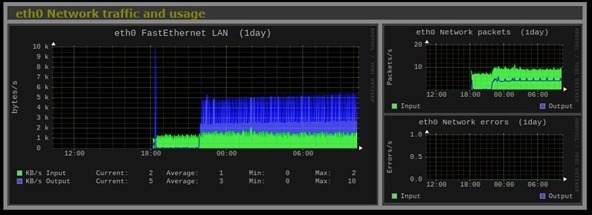
 I recently did a post asking for input about useful tools for the Raspberry Pi and other SBC boards and the first to some out of this is Monitorix.
This is just a short blog – I’ve not had enough time to ensure I understand the usefulness of this – but at least on the Pi3 (which is happily running on my desk from a hard disk!!) and at least in the short time I’ve played with it – this looks like a useful tool. Reader @thebaldgeek pointed me to a system monitoring tool called Monitorix – sadly the first set of online instructions I read failed miserably – however after a short exchange of messages we got it running.
Here’s how:
cd /home/pi
wget http://apt.izzysoft.de/ubuntu/dists/generic/monitorix_3.10.0-izzy1_all.deb
sudo dpkg -i monitorix_3.10.0-izzy1_all.deb
After that all I did was go in and update the HOST entry – I had to put in the IP number of my PI (192.168.0.55) and not 127.0.0.1 but I might have missed the point…
sudo nano /etc/monitorix/monitorix.conf
After making that change or any change the next line is essential
sudo service monitorix restart
and that was it – clearly your IP address will be different and you can change the port number in that config file –
A picture is worth 1000 words so I’ll leave you with this – which is only a TINY proportion of the available information.


Personally, I use Grafana with Telegraf which is from the same people as InfluxDB. The metrics from the Pi are easily consumed in Grafana. Telegraf is pretty light weight and has loads of different input and output plugins.
It also has lots of pre-built options for easy install and update including Pi’s.
Oh, and for those times you want immediate answers at the terminal – I use Glances.
I use Grafana and InfluxDB – never got around to Telegraf as I get all the graphing I want out of Grafana and influxDB due to the influx node for Node-Red.
Of course, but when you want to add a dashboard that includes Pi metrics, Telegraf makes it trivial – rather than adding an entire new thing just to chart the pi performance.
Just sayin.
OR – if you want to do both… ie some temperature and humidity monitoring and self monitoring (and I only just thought of this) – I’ve been using Node-Red, firing out sensor information to Grafana but never thought of metrics of the machine itself.
And yet… I normally get all that info for a command line update from PYTHON using PLATFORM – if you check https://tech.scargill.net/ssd1306-with-python/ there is all sorts of info about using Platform for Python to get all manner of processor/memory/disk related info… until right this minute and your comment, it never occurred to me to use that (calling from Node-Red) to funnel such info into Grafana.
OH WHAT A GOOD IDEA!!!!!
Haha! Well Node-RED can get anything Python can too – there are libraries for pretty much everything. But it is much easier to simply plug into syslog, systemd, the many Linux /proc files and so on, Telegraf simply makes it easier by reducing it all to a few configuration lines. Not the only way of doing it by any means. But it is written in Go which is significantly more resource efficient than Python in general.
So the (many) choice(s) is/are yours!
I’m sure Node-Red CAN do anything Python can do IF you know where to look – but the two together… it’s not what you know, it’s how fast you can fasten libraries together (old Chinese saying)….
There’s a nice node called node-red-contrib-ovia-os which gives lots of info – sadly NOT CPU temperature and I’m interested in that to watch the temperature through a script install – just because I can.
keep an eye out because in a couple of hours – the NEXT blog entry describes a JSON string in Node-Red coming from a call to Python (code provided) with some system info to bang into Grafana (or whatever you like to use). Working on it now.
The point being of course that unlike a Node which gives you what the author wants you to have – this way you get anything from any library you choose to add in… including temperature – which MAY or may not need a tiny mod depending on the board type.
I fully understand Peter. I was using Python long before I got into JavaScript. There are a couple of other nodes too that report back some info like Pi temperatures.
Truth is, most of that information is available via /proc in the filing system if you know where to look.
But, as I mentioned, I’d personally much prefer to use something that already knows how to do all that which is why I use telegraf for pushing to grafana dashboards or Glances for a quick peek.
Great idea. I will add it to my to-do list. But for a start, add port 1883 to the ‘Ports’ section of the config file and track the amount of traffic that your network sees.
I have added influxdb port, and all is ok, but with mqtt port, no result…
Monitorix looks nice, but on the GitHub repo I didn’t find any reference or support for our ubiquitous Mqtt. It would be nice to use it to graph Mqtt sensors last hour/day/week/month/year. Someone tryied it?
It would be nice – and we’d love to hear from someone who has done this!!!
grafana isn’t enough? 🙂
Hi Pete,
Thanks for sharing this. Just to let you and others know downloaded the .deb file and installed it onto two of my Orange Pi Zeros and it works fine. I had to ‘apt-get install’ a few dependencies first: –
apt-get install rrdtool libwww-perl libmailtools-perl libmime-lite-perl libdbi-perl libxml-simple-perl libhttp-server-simple-perl libconfig-general-perl libio-socket-ssl-perl
Then I just tweaked the config file to use an alternate TCP port as I already use 8080 for something else …and it worked first time.
Thanks Darren – I guess we just have to bear in mind the potential wear if using an SD.
Yes indeed – always worth bearing in mind. On a related subject, I’m currently running a trial on a Chinese “Kingdian SSD” after seeing one in one of Andreas Spiess videos. So far so good and it powers fine off a single USB cable hanging out of the back of an RPi3 – much less power hungry than traditional ‘moving parts’ SATA drives. Too early to give any proper verdict but it works and it appears to perform fast enough.
I have one of those on my FriendlyArm Duo – or at least on the base unit for it. Seems fast, no idea how reliable it will be. Time will tell – do let us know how you get on.
Peter:
Monitorix is constantly writing to /var/lib/monitorix and /var/lib/monitorix/www/imgs directories. To the first one every minute to update RRD files and to the second (Where all those 82 images used by the web page are created) every time you refresh the page or automatically every 150 seconds when the page is refreshed. If this directory is located in your SD card then it is going to wear out soon.
Thanks for that Juan – in my case it is to a hard drive… since discovering 60GB drives DIRT cheap on Ebay, I’m using those now – and putting a little 256MB SD in the Pi and other devices to boot up.
But for those using SD – your point is very important!!
Pete, have you done a write up on how to set this up?
I have been running Monitorix on my Pi’s for (in some cases) years and never had a problem, but I would love to move some of the more established Pis over to hard drives.
I also want to get around to trying ‘The Script’ for the first time and would rather do it once on a hard drive……
you can do that even after installing everything… we worked on instructions on how to move/copy an install from sd to hd, and eventually sync back changes so you can return to the sd alone… look past articles on the blog… 🙂
Hi thebaldgeek…. I constantly refer back to this article https://tech.scargill.net/neo2-nas-part-two/ which I’ve updated.
So the general principle is to put the hard drive onto the Pi – with as short a USB lead as possible – preferably… like a few inches…. and having checked which drive it is – usually SDA.. create a partition for it – it’s all in that blog entry – easy – and use RSYN on the Pi (or whatever) to copy the second partition from the Pi over to the hard drive – that’s the root file system (everything but boot basically).
Then on the Pi it is quite easy – simply make a change in cmdline.txt to point not to the SD partition but to the relevant partition on the hard drive
root=PARTUUID=0c6eaa35-02
That’s mine – yours will be different. Now you COULD just put for example /dev/sda1 but apparently there could be an issue there if you plugged something else in there like another drive or usb memory stick… the SDA name is not guaranteed.
And where do you get that name from ??
blkid
So in my case
pi@pihd1:~ $ blkid
/dev/mmcblk0p1: LABEL=”boot” UUID=”E5B7-FEA1″ TYPE=”vfat” PARTUUID=”011b74cf-01″
/dev/sda1: SEC_TYPE=”msdos” UUID=”E48A-26B5″ TYPE=”vfat” PARTUUID=”0c6eaa35-01″
/dev/sda2: UUID=”b21ba296-fad1-4ed0-ac7a-5457debbf066″ TYPE=”ext4″ PARTUUID=”0c6eaa35-02″
pi@pihd1:~ $
Note I have another partition on that disk so I’m using the second one.
No there are claims you can put the whole lot on the hard drive on the Pi3 – but after lots of reading – as it just would NOT work on my drive, it is known not to work too well with some USB devices…
So – you can leave your costly SD in the machine or on non-Pi machines follow my guidelines in the entry above for making a small SD – APPARENTLY on genuine Raspberry Pis you don’t have to go through the hassle of using DD – just format a small – say 256MB SD to FAT32 and copy over all the files from the BOOT folder…. referring of course to the new drive as above.
So right now I have a nice metal case for my Pi3 and I’ve mounted (double sided foam to get rid of vibration transfer) a so-called “Samsung” 60GB hard drive to the top of the box, with a short USB lead. The’res a one-liner for increasing the USB current – I didn’t need it but thought it prudent to add to config.txt
# Double up available USB current
max_usb_current=1
and that’s it – next stop an uninterruptible supply – my first prototype (see blog) hasn’t got enough clout to handle a Pi3+disk but the next one will… and I should have a fairly bullet-proof Pi for long term use.
As to the cost of drives, well, some purist will tell me I’m using the wrong type but these seem to work a treat and cost less than some SDs. Black looks nice.
http://www.ebay.co.uk/itm/Portable-External-2-5-inch-Hard-disk-drive-Backup-Slim-Ultra-60GB-USB-2-0/182723724239?hash=item2a8b2ec3cf:m:mSNf2YueUfGSzzmTCyFLv5A
or using rpi-clone: https://tech.scargill.net/easy-backups-and-webmin/
Pete, thanks for the extensive reply. (I did do a search of the blog first, but the title of the blog threw me off-I will know better next time!).
I have a few 64Gb SSD’s drives from small dual drive laptops that I want to try this one, so will dig in and see how we go.
Let us know how you get on.
Interestingly, I’ve been running my main HA Pi – that has Node-RED, Mosquitto, InfluxDB, Telegraf and Grafana all running – for well over 2 years now 24×7. It writes to disk at least twice a second and I’ve had no SD card issues at all!
I’m using a 64Gb Samsung EVO. I think having the extra space is part of the trick as levelling has plenty of room to work.
Yes I think the extra size might have something to do with it also the hardware is slightly different on the 64GB units. I recall from the long conversation on the subject in an earlier blog, we came to the conclusion that choice of SD – and power supplies – played a great role in reliability on these devices. I’m using a hard drive as the 60GB drives are actually cheaper than 64GB SDs and hopefully less chance of getting a counterfeit – though my little drive says Samsung and I’m pretty sure Samsung have never been near it.
Certainly hard to beat that price. Doubtless if/when my SD card fails, I will try this out then.
You are right about power. Learned that the hard way when starting to play with Pi’s. Mine is now attached to a desktop UPS along with other “critical infrastructure” like the router, switch and NAS.
Picked up 2 of them cheap many years ago. They are on their second battery now. A little hacking made it easy enough to replace the batteries even though these units haven’t been made for years.
Oh UPS – if you work for a company who use UPS systems – and if you happen to get on with the techy – always take the opportunity to ask (shy bairns get nowt) what they do with old UPS.
I asked my tech in a previous life and he said – oh, we send them off for destruction. Having convinced him there’s no important data hidden in them I convinced him to let me have them instead. These were 1KW units – every year the batteries are checked and typically after 3-6 years the units themselves get replaced (unless the company is REALLY tight)…. and yet, they rarely go wrong – the batteries just give up.
So typically they may have a pair of 7AH alarm lead acid batteries in them – simply open up, disconnect and dispose of the originals and replace with new – and you’re up and running. My PC has been protected by one of those things for years. Sadly the battery protection on most is about as effective as burnt bacon protection in a typical oven – i.e. none – so the old batteries might be slightly expanded 🙂 But they’ll come out.
Hi Pete
The one metric, I’d dearly love to see here, is disk writes for Monitoix itself. We definitely dont want to be slamming the SD cards on our PI’s, all for the sake of some pretty graphs.
1st block to install cockpit, 2nd one to install monitorix, using standard apt-get
i tested the latter on a public vps server i have, no need to modify the config file to access monitorix from web
echo “deb http://deb.debian.org/debian stretch-backports main” |sudo tee /etc/apt/sources.list.d/backports.list
#echo “deb http://deb.debian.org/debian jessie-backports-sloppy main” |sudo tee /etc/apt/sources.list.d/backports.list
sudo apt-get -y update
sudo apt-get -y install cockpit
echo “deb [arch=all] http://apt.izzysoft.de/ubuntu generic universe” |sudo tee /etc/apt/sources.list.d/monitorix.list
wget http://apt.izzysoft.de/izzysoft.asc -O – | sudo apt-key add –
sudo apt-get -y update
sudo apt-get -y install monitorix
Oh well done Antonio
for cockpit, if using ubuntu you can just run:
sudo apt-get -y update
sudo apt-get -y install cockpit
while for debian these are the correct lines (the commented line is for jessie, if you still use it… in case, obviously comment out the stretch one…)
sudo apt-key adv –recv-key –keyserver keyserver.ubuntu.com 7638D0442B90D010
echo “deb http://deb.debian.org/debian stretch-backports main” |sudo tee /etc/apt/sources.list.d/backports.list
#echo “deb http://deb.debian.org/debian jessie-backports-sloppy main” |sudo tee /etc/apt/sources.list.d/backports.list
sudo apt-get -y update
sudo apt-get -y install cockpit
thanks, like it under jessie. need to do an backport for tuned!
pi@raspberrypi:~ $ wget http://apt.izzysoft.de/ubuntu/dists/generic/monitorix_3.10.0-izzy1_all.deb
URL transformed to HTTPS due to an HSTS policy
–2017-11-08 19:29:32– https://apt.izzysoft.de/ubuntu/dists/generic/monitorix_3.10.0-izzy1_all.deb
Resolving apt.izzysoft.de (apt.izzysoft.de)… 144.76.109.57
Connecting to apt.izzysoft.de (apt.izzysoft.de)|144.76.109.57|:443… connected.
HTTP request sent, awaiting response… 404 Not Found
2017-11-08 19:29:33 ERROR 404: Not Found.
I tried with https, a trailing /, and also with the two previous versions, 3.9.0 & 3.8.1
The latest source code is at https://github.com/mikaku/Monitorix/releases