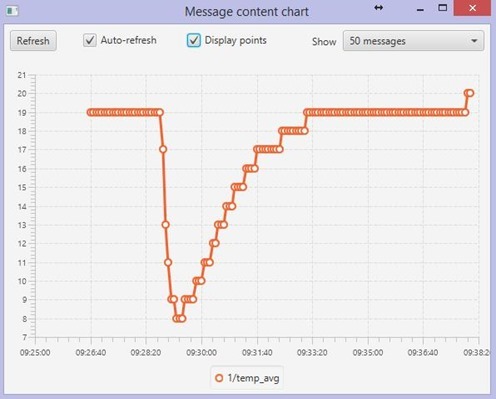
As a background job, some of you will know I’ve been looking at averaging temperature readings as there can be a little variation when reading the DS18b20 for a variety of reasons, though nothing like the horrors I saw when using ESP201. On the ESP-10 with a 12” lead I’m getting quite steady readings as you’ll see in this graph. The massive dip to –17c is down to me using the freezer spray on the chip head (well, you have to test these things).
So there we have it… a constant 19c in my office until I hit the chip with the freezer spray (readings every 5 seconds) and an instant drop to –17c followed by the slow climb up back to 19c.
I’m also taking an average reading…
os_sprintf(tBuf, “%d”, (int)(temperature_average+0.5));
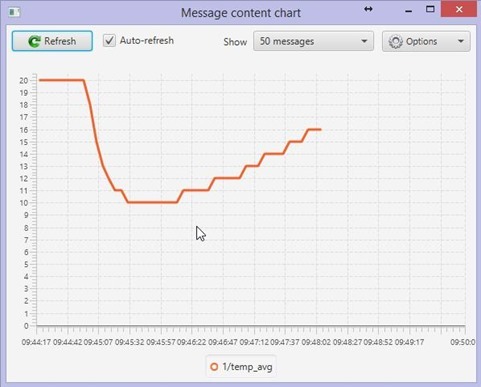
and that produces this output
It doesn’t actually look any better but of course it’s only dropping down to 8c. Clearly however I need to do a much better job of smoothing than this – averaging 8 readings is clearly not enough – perhaps a better way that can ignore really rapid changes altogether… let’s face it – opening the door isn’t going to cause a drop in temperature even remotely like that! However, the smoothing process does work and thanks to others for the suggestion.
And how am I producing these graphs? With MQTT-SPY of course. This excellent program has been evolving a lot recently and I like to think the graphing feature was at least partly largely down to my gentle encouragement. What’s missing is the ability to zoom into the image to check out a particular area so a couple of days ago I wrote off to the author and pushed my luck by asking him for such a feature.
In this morning’s mailbox I received a reply and…so NOW we can zoom in and out using he mouse centre wheel and right button.
For those new to this program it’s a free JAVA program (just runs on my PC) which is excellent, you can publish MQTT messages, subscribe to others and now graph the results of incoming data all without any great new learning curve. You can even run automated scripts if you want to send messages out… Rather handy for generating time messages (there’s an example in the WIFI I believe) and you can control what happens if the connection fails etc. MQTT-SPY is also fast and responsive, not at all what I expected from a Java program.
This just keeps getting better and better. Head on over here to get the .JAR file. I put mine in /users/peter/mqtt-spy to hold it all together as it generates log files and more. All you need is the one file – no big installation. Excellent. If you find it really useful the author suggests a donation to UNICEF.
Important – read the OVERVIEW wiki before griping about zooming control – it’s all in there.


i cant send message from cloudmqtt.com by esp8266 what can i do.